For those not already familiar with it, DXLab is a freeware suite of 8
applications designed primarily for DXers. Each application can be run
individually, but they sense each other's presence and automaticly
interoperate. DXLab include significant support for forecasting and
monitoring propagation:
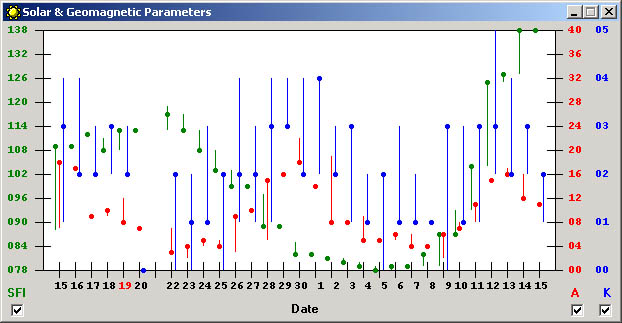
1. By monitoring up to 4 telnet clusters, a local packet cluster, and
the DX Summit web cluster, SpotCollector automatically captures WWV
reports, and maintains the last 30 days of SFI, A, and K parameters. It
continuously displays the most recent values, and plots the historic
data in a way that makes it easy to project upcoming changes based on
the sun's 27-day period of revolution. See
http://www.qsl.net/spotcollector/Solar.jpg for an example; the display
can be a little busy with all three parameters shown, but the checkboxes
let you disable one or two for a clearer view of the remainder.
2. DXView uses the current K-index to plot the auroral boundaries on its
world map; in combination with its visual display of beam headings,
assessing a signal's auroral interaction is straightforward. DXView also
computes and display's a signal's maximum magnetic latitude
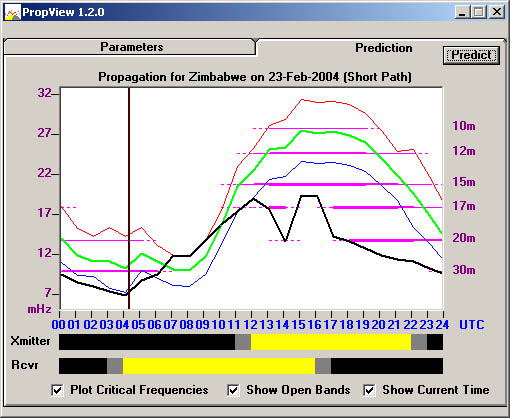
3. If you enter a callsign, gridsquare, or IOTA tag in DXView, or just
click on a location on its map, PropView can with one mouse click
compute and display a 24-hours propagation forecast, using the IONCAP
engine and most recent SFI data provided by SpotCollector. The results
are QST-style graphs showing the likely-useable frequencies at each
time-of-day, based on both MUF and LUF. See the example in
http://www.qsl.net/propview/propview.jpg ; note that the display shows
the day/night transitions at each end of the circuit.
4. DXView can produce 30-day sunrise-sunset calculations for your QTH
and any location you specify by entering a callsign, gridsquare, or IOTA
tag, or by clicking on a location on its map. This makes it easy to seek
out opportunities for grey-line propagation.
5. PropView allows you to assemble a schedule of IARU/NCDXF beacons to
monitor. These beacons cyclicly transmit on fixed frequencies in the
10m, 12m, 15m, 17m, and 20m bands. Every 10 seconds, PropView will QSY
your transceiver (via Commander) and/or rotate your directional antenna
(via DXView) to the next beacon. Assessing "actual propagation" is a
great way to refine and understand propagation forecasts. For this to
work,your PC's clock must be accurate to the second, something easily
achieved with freeware like AboutTime.
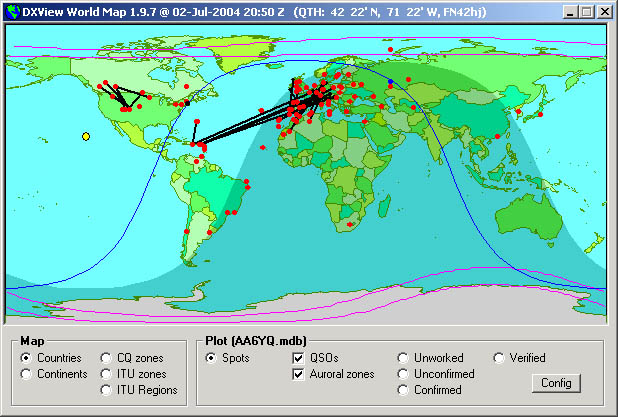
6. For each incoming DX spot, SpotCollector attempts to determine the DX
station's grid square and the spotting station's grid square. It does
this by inspecting the spot notes, and by capturing grid squares
appended to spots by nodes running DXSpider cluster software.
SpotCollector forwards this information to DXView. When grids for both
"ends" of a spot are known, DXView can plot these on the world map --
providing a graphical view of actual propagation. This capability has
been excellent for quickly revealing Es openings on 6m and 2m this
summer. To see what this looks like, take a look at
http://www.qsl.net/dxview/WorldMap.jpg .
All of these applications are available via www.qsl.net/dxlab -- and
they are all free.
73,
Dave, AA6YQ
_______________________________________________
Propagation mailing list
Propagation@contesting.com
http://lists.contesting.com/mailman/listinfo/propagation
|